

HARNESS THE POWER OF STATISTICS
Minitab Statistical Software
Visualize, analyze, and harness the power of your data to solve your toughest business challenges from anywhere on the cloud.
Data finns överallt. Använd den för att nå er fulla potential.
Minitab Statistical Software can look at current and past data to discover trends, find and predict patterns, uncover hidden relationships between variables, and create stunning visualizations to tackle even the most daunting challenges and opportunities.

Discover.
Regardless of statistical background, Minitab empowers all parts of an organization to predict better outcomes, design better products, and improve processes to generate higher revenues and reduce costs. Only Minitab offers a unique, integrated approach by providing software and services that drive business excellence from anywhere with the cloud.
Key statistical tests include t tests, one and two proportions, normality test, chi-square, and equivalence tests

Predict.
Access modern data analysis and explore your data even further with our advanced analytics. Skillfully predict, compare alternatives, and forecast your business with ease using our revolutionary predictive analytics techniques.
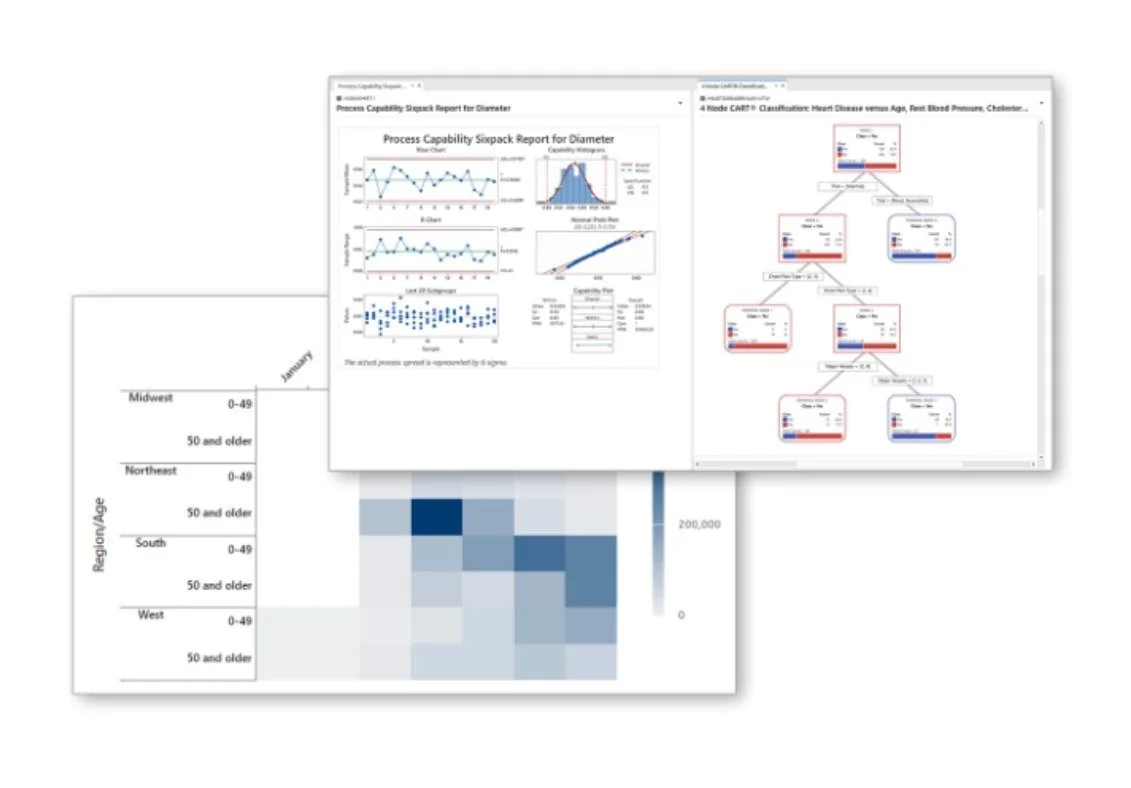
Use classical methods in Minitab Statistical Software, integrate with open-source languages R or Python, or boost your capabilities further with machine learning algorithms like Classification and Regression Trees (CART®), TreeNet® and Random Forests®, now available in Minitab's Predictive Analytics Module.
Achieve.

Seeing is believing. Visualizations are critical to accurately communicate findings and achievements. Deciding which graph best displays your data and supports your analysis is fast and easy with Graph Builder.
Our new interactive tool with an easy-to-browse gallery lets you view and explore multiple graph options without re-running your analysis. Using the same selection of data each time, Graph Builder seamlessly updates from bar charts to correlograms to heat maps and more, so you can focus on choosing the best visual for your insights.
MINITAB STATISTICAL SOFTWARE VERSION 22
Den senaste versionen av Minitab Statistical Software är här
Expanded Statistical Features

Nonparametric Capability Analysis
Nonparametric Capability provides a robust solution for evaluating the capability of a process where no distribution or transformation is appropriate.

EMP methods for Gage Studies
Evaluate Measurment Process (EMP Crossed) provides the tools to assess the process variation in a measurement system with crossed designs using the preferred Wheeler’s EMP criterion.

Improved 1-proportion Test
Several imporvements have been made to the 1-proportion Hypothesis Test and Confidence Interval commend.
Enhanced AI

Automated Capability Analysis
Automated capability determines the appropriateness of the normal distribution and automatically presents alternative distribution fits or transformations.
Interactive Table Builder
Interactively explore relationships between variables and build meaningful descriptive statistics tables using the graph builder’s drag-and-drop interface and live preview.
Enriched Visualizations

Interactive Pareto Chart in Graph Builder
Graph Builder now includes an interactive Pareto Chart tool to identify features like defects to prioritize or the characteristics that contribute most to an outcome.

Enhanced Graph Editing
Interactively customize results with the new graph editing features includes guidlines show/hide gridlines at major tick positions, add reference lines, and Y-value data labels.
PRESS RELEASE FROM MINITAB STATISTICAL SOFTWARE.
MINITAB STATISTICAL SOFTWARE
Moduler för anpassade behov
Predictive Analytics Add-On
Minitab's Predictive Analytics Module equips you with the tools to forecast trends, anticipate outcomes and make proactive decisions based on data patterns. Watch the video below to learn more about the power of Predictive Analytics.
Customer Contact Center
Utilize Minitab's Customer Contact Center Module to enhance customer satisfaction through data-driven insights, improving your approach to customer service
Healthcare
Minitab's Healthcare Module includes the power of statistical software to solve your most pressing healthcare and patient care related challenges.
Insurance Industry
Add your pricing strategy. Be sure to include important details like value, length of service, and why it’s unique.
Supply Chain
Whether you want to conduct Design of Experiments, Hypothesis Testing, Interval Estimation or something else, Minitab's Supply Chain Module can help.
Measurement System Analysis
Make confident decisions with Minitab's Measurement Systems Analysis Module, which enables you to conduct Gage R&R studies, Destructive Gage R&R studies, Bias studies and more.
Reliability Analysis
Assess risk and reliability of products to prevent failures with the Reliability Module.
Sample Size
Achieve optimal sample sizes efficiently using Minitab's Sample Size Module, ensuring your experiments yield statistically significant results without unnecessary resource allocation.
Research and Development
Minitab’s Research and Development Module was designed specifically for professionals in the R&D field.
Minitab Download
Within 30 days of your purchase of Minitab Statistical Software or Minitab Workspace, you are required to download the software.
During installation, you will be prompted to enter the provided product key. If you do not enter your product key at this time, you will be prompted to enter the product key each time you launch the software during the next 30 days. You must enter the product key to continue use of the software beyond those 30 days.
If your software download has expired, please contact us