Getting Real: A Simple Way to Assess Process Capability without Complex Assumptions
Process capability measures, such as Cpk and Ppk, measure how well your process is performing relative to your customer’s specifications. Let’s review some capability analysis basics and then delve into another capability estimate, Cnpk, that likely has a very useful place in your capability analysis arsenal.
Capability Statistics Unpacked
Using a single number, capability statistics provide a unit-free metric for assessing whether a process is capable of meeting specified requirements and for identifying areas for improvement. To that end, these popular estimates can be thought of as the ratio of the “Voice of the Customer” to the “Voice of the Process”.
We can easily measure the “Voice of the Customer” – it’s the acceptable tolerance, or distance between specification limits. Measuring the “Voice of the Process” is a little trickier and is often done by assuming measurements come from a population shaped like a bell-shaped curve. This has the convenient property of being roughly 6 standard deviations wide, making the “Voice of the Process” roughly 6 times the standard deviation.
If the tolerance and the process spread are the same length, the ratio of the “Voice of the Customer” to the “Voice of the Process” is then roughly equal to 1.0. Ideally, though, we have a bit of a buffer zone between our specifications and where the process falls in order to ensure minimal defects. Thus, for a process with minimal defects, the tolerance must be wider than the process spread making their ratio greater than 1. In fact, common benchmarks for acceptable capability statistics like Cpk and Ppk are 1.33 and 1.67.
Capability Statistics Practise
Unfortunately, real-life situations are often more complicated than this textbook example. For example, sometimes we only have one specification limit, often the distribution isn’t centered between our specification limits, and it turns out that standard deviation can be measured in more than one way. Refer to this discussion for more information on these important issues. Also, while we’re thinking about data in the real world, we will likely discover that there are many situations when data do not follow the bell-shaped curve of a normal distribution.
In the context of Capability Analysis, the shape of the data is a key component of how we measure the process spread. If the data deviates significantly from the assumed distribution, metrics such as Cpk and Ppk will not accurately reflect the process capability. Fortunately, Minitab Statistical Software includes a robust set of Nonnormal Capability Analysis tools when you do run into that pesky nonnormal data situation.
But what if you have you have already attempted the tried-and-true options for scenarios when the normal distribution does not fit? In other words, what can we do when the Anderson-Darling p-values from Stat > Quality Tools > Individual Distribution Identification are all below the 0.05 benchmark, indicating that none of the offered distributions or transformations are appropriate?
When Alternative Distributions/Transformations Fall Short
I recently ran into this exact case while working with a company that manufactures tubing used for medical devices that deliver IV solutions. This company needed to show the US Food and Drug Administration that their tubing was capable of meeting a stated tensile strength specification.
Below are the results I obtained from Minitab Statistical Software’s Individual Distribution Identification.
When using an Anderson-Darling Goodness of Fit Test, a p-value above 0.05 generally indicates that it is appropriate to use the corresponding distribution or transformation when estimating capability. In this case, however, none of the methods meet that criterion.
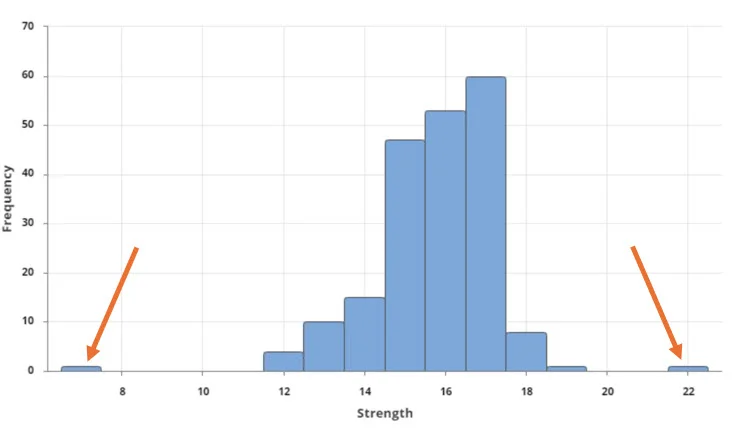
Let’s take a closer look at this data to see where the problem lies. Using Graph Builder (Graph > Graph Builder), I can see from the histogram below that one of the sample pieces of tubing broke at a lower force than expected and another piece of tubing was stronger than expected. Outliers are the most common reason why distributions or transformations won’t help in cases like this. By definition, an extreme outlier won’t fit into the general pattern of the data.
It is important to investigate extreme outliers and attempt to understand what caused them. The outlier(s) may be measurement errors or data entry errors, in which case they do not represent the true process and should appropriately adjusted. If they are legitimate values, your number one priority should be to prevent future outliers from occurring and strive for process stability, but you probably still need a capability estimate to get your product out the door.
A Distribution-Free Solution for Assessing Capability
One of the best new features in Release 22 of Minitab Statistical Software is its Nonparametric Capability Analysis. This analysis provides a reasonable estimate of the capability of your process without the more complicated assumption of a distribution. To access this useful feature, choose Stat > Quality Tools > Capability Analysis > Nonparametric.
For the medical tubing data, you can see that even with that snafu of two outliers, the process was still capable of meeting its lower specification limit. You can interpret the nonparametric capability statistic, Cnpk, just as you would other capability statistics such as Cpk and Ppk. In this case, Cnpk = 1.39 which exceeded the company’s capability goal of 1.33.
Distribution assumptions are essential for capability analysis because they underpin the calculations, interpretations, inferences, and decisions based on the analysis results. However, it's also important to recognize that real-world data may not always perfectly adhere to these assumptions. Adding a simple, distribution-free method to your toolkit will enable you to obtain appropriate capability estimates even when your real-life data refuse to fall into the pattern of any known distribution.
Original post by Cheryl Pammer for Minitab


